The fastest way to analyse and compare data across multiple spreadsheet files.
Plottern is a suite of powerful tools designed to help you find trends, patterns and cycles in data such as signals and sensor readings.
Automate processing of multiple data files
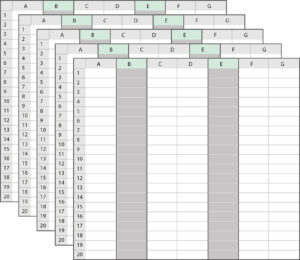
Import multiple XLSX, CSV and TSV files simultaneously and select from multiple files, cell ranges and worksheets. Load all of your files in one click, select the series and cell ranges you want and click plot. You can import the same cell range from one set of files and a different cell range from another set of files. The data you create can be exported as one new file.
Intuitive, direct data editing
Plottern lets you compare data, find patterns and extract information faster. It is packed with powerful direct editing tools to drag, align, flip, trim, filter, duplicate, extract and merge your data. Operations which would be difficult and time consuming in a spreadsheet application are handled in a couple of clicks.
Communicate with clarity
Plottern makes your data the hero. Fully customisable styles and themes make it easy to create graphs which are on-brand, accessible and communicate the important information effortlessly. Plottern comes with styles including line, scatter and bar charts along with presets for patent documents and accessibility for people with colour blindness.

Cut through the noise
Plottern lets you quickly and easily pick out the data you want and cut out the rest. Built-in statistical functions such as standard deviation, running totals and moving averages let you quickly find new insights across datasets.